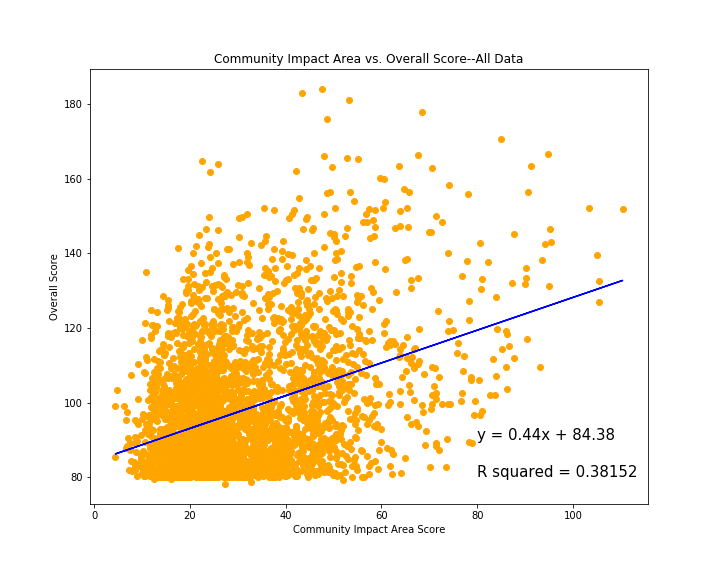
The community impact area evaluates the company's positive impact on the external communities in which the company operates.
The scatter plot below maps the community impact area scores of all US B Corps in our dataset vs
their overall impact scores shows that variation in overall impact scores can be explained about
38% of the time by variation in community impact scores. Click graph to enlarge.
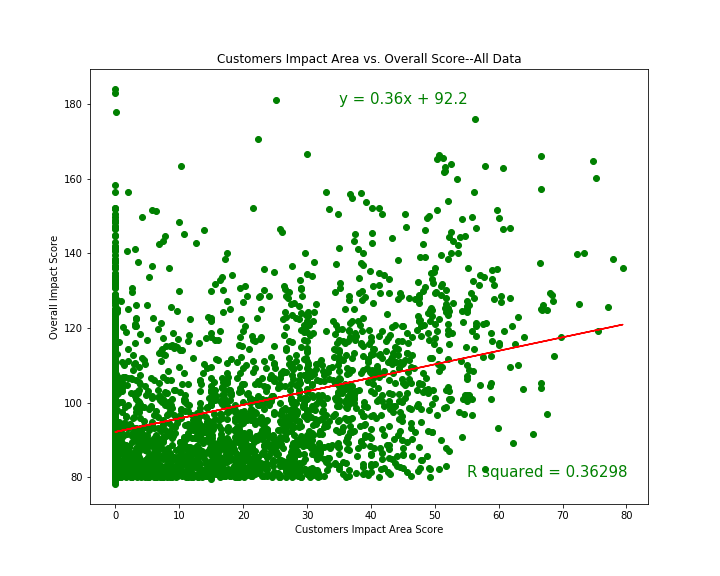
The customers impact area evaluates the company's value to their direct customers and consumers
of their products and services, and asks questions like whether the company specifically benefits
underserved populations, addresses social and/or economic problems, or helps create access to basic
services. The below scatterplot mapping the customers impact area score vs. the overall impact score
shows that variation in overall impact score can be explained by variation in the customers impact score
about 36% of the time. Click graph to enlarge.
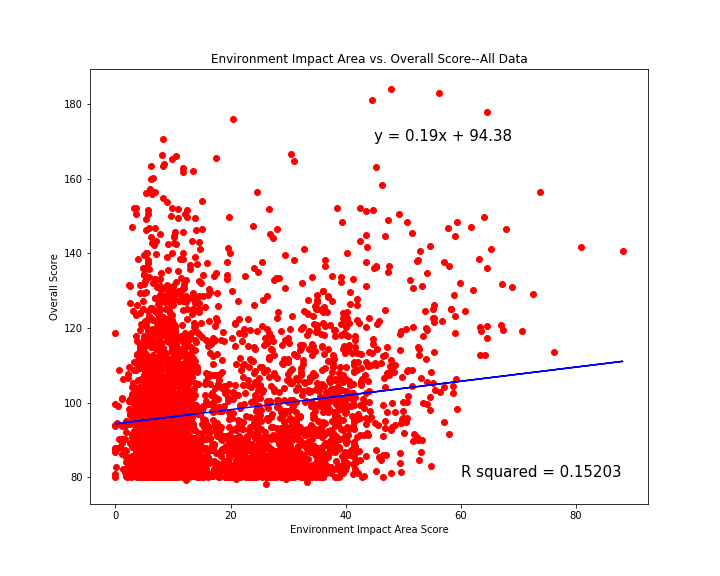
The environment impact area measures overall environmental stewardship of the company.
This impact area asks questions such as how the company identifies and manages general
environmental impacts, specifically with air and climate issues, water sustainability, and
impacts on land and life. The scatterplot below maps the environment impact score vs the
overall impact score and shows that variation in overall impact scores can be explained about
15% of the time by variation in environment impact sores. Click graph to enlarge.
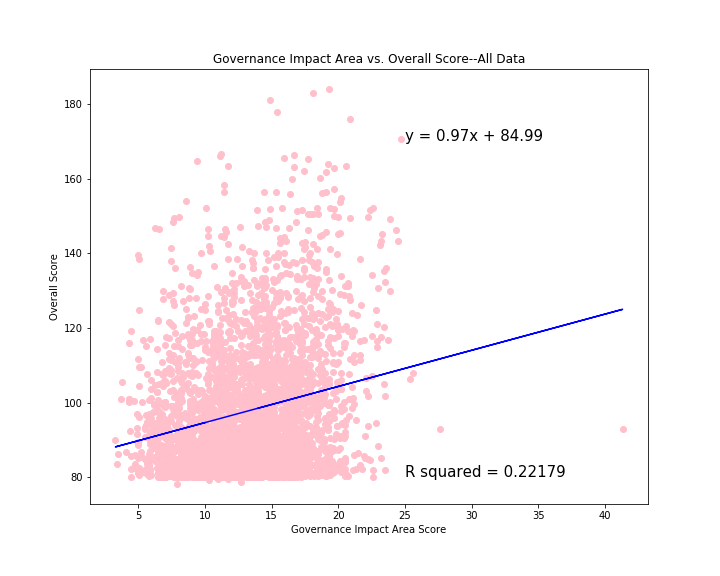
The governance impact area evaluates the overall mission ethics, accountability, and transparency
of the company itself, asking questions that are largely centered around whether the company incoporates
internal review of social and environmental performance principles, among other measures. The scatterplot
below maps the governance impact area score vs the overall impact score shows that variation in overall impact
scores can be explained by variation in the governance impact score about 22% of the time. Click graph to enlarge.
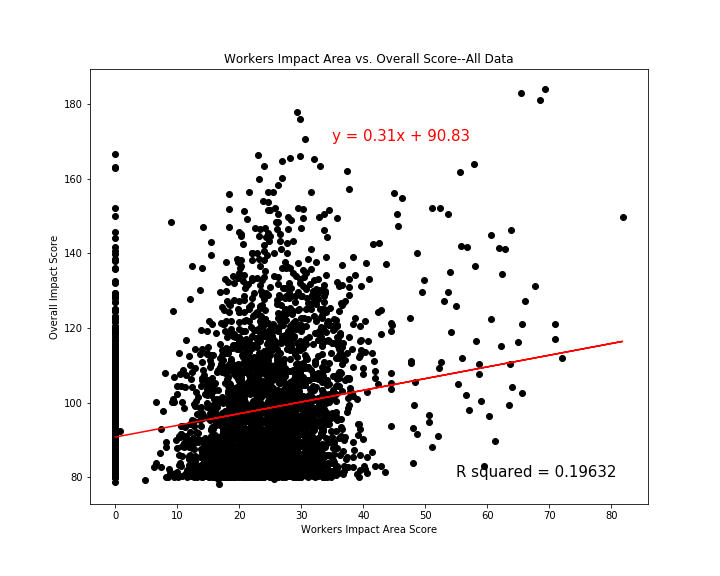
The Workers Impact Area evaluates a company’s contribution to financial, physical, professional, and social
well-being, and asks questions primarily centered around whether most employees are full time, part time, or
temporary, and whether their compensation is fixed, hourly, or daily, and weather the company is committed to
hiring underemployed populations. A scatterplot mapping the workers impact area score vs. the overall impact
shows a loose linear relationship between the two areas, and that variation in the overall impact score can be
explained by variation in the workers impact score about 19% of the time. Click graph to enlarge.